
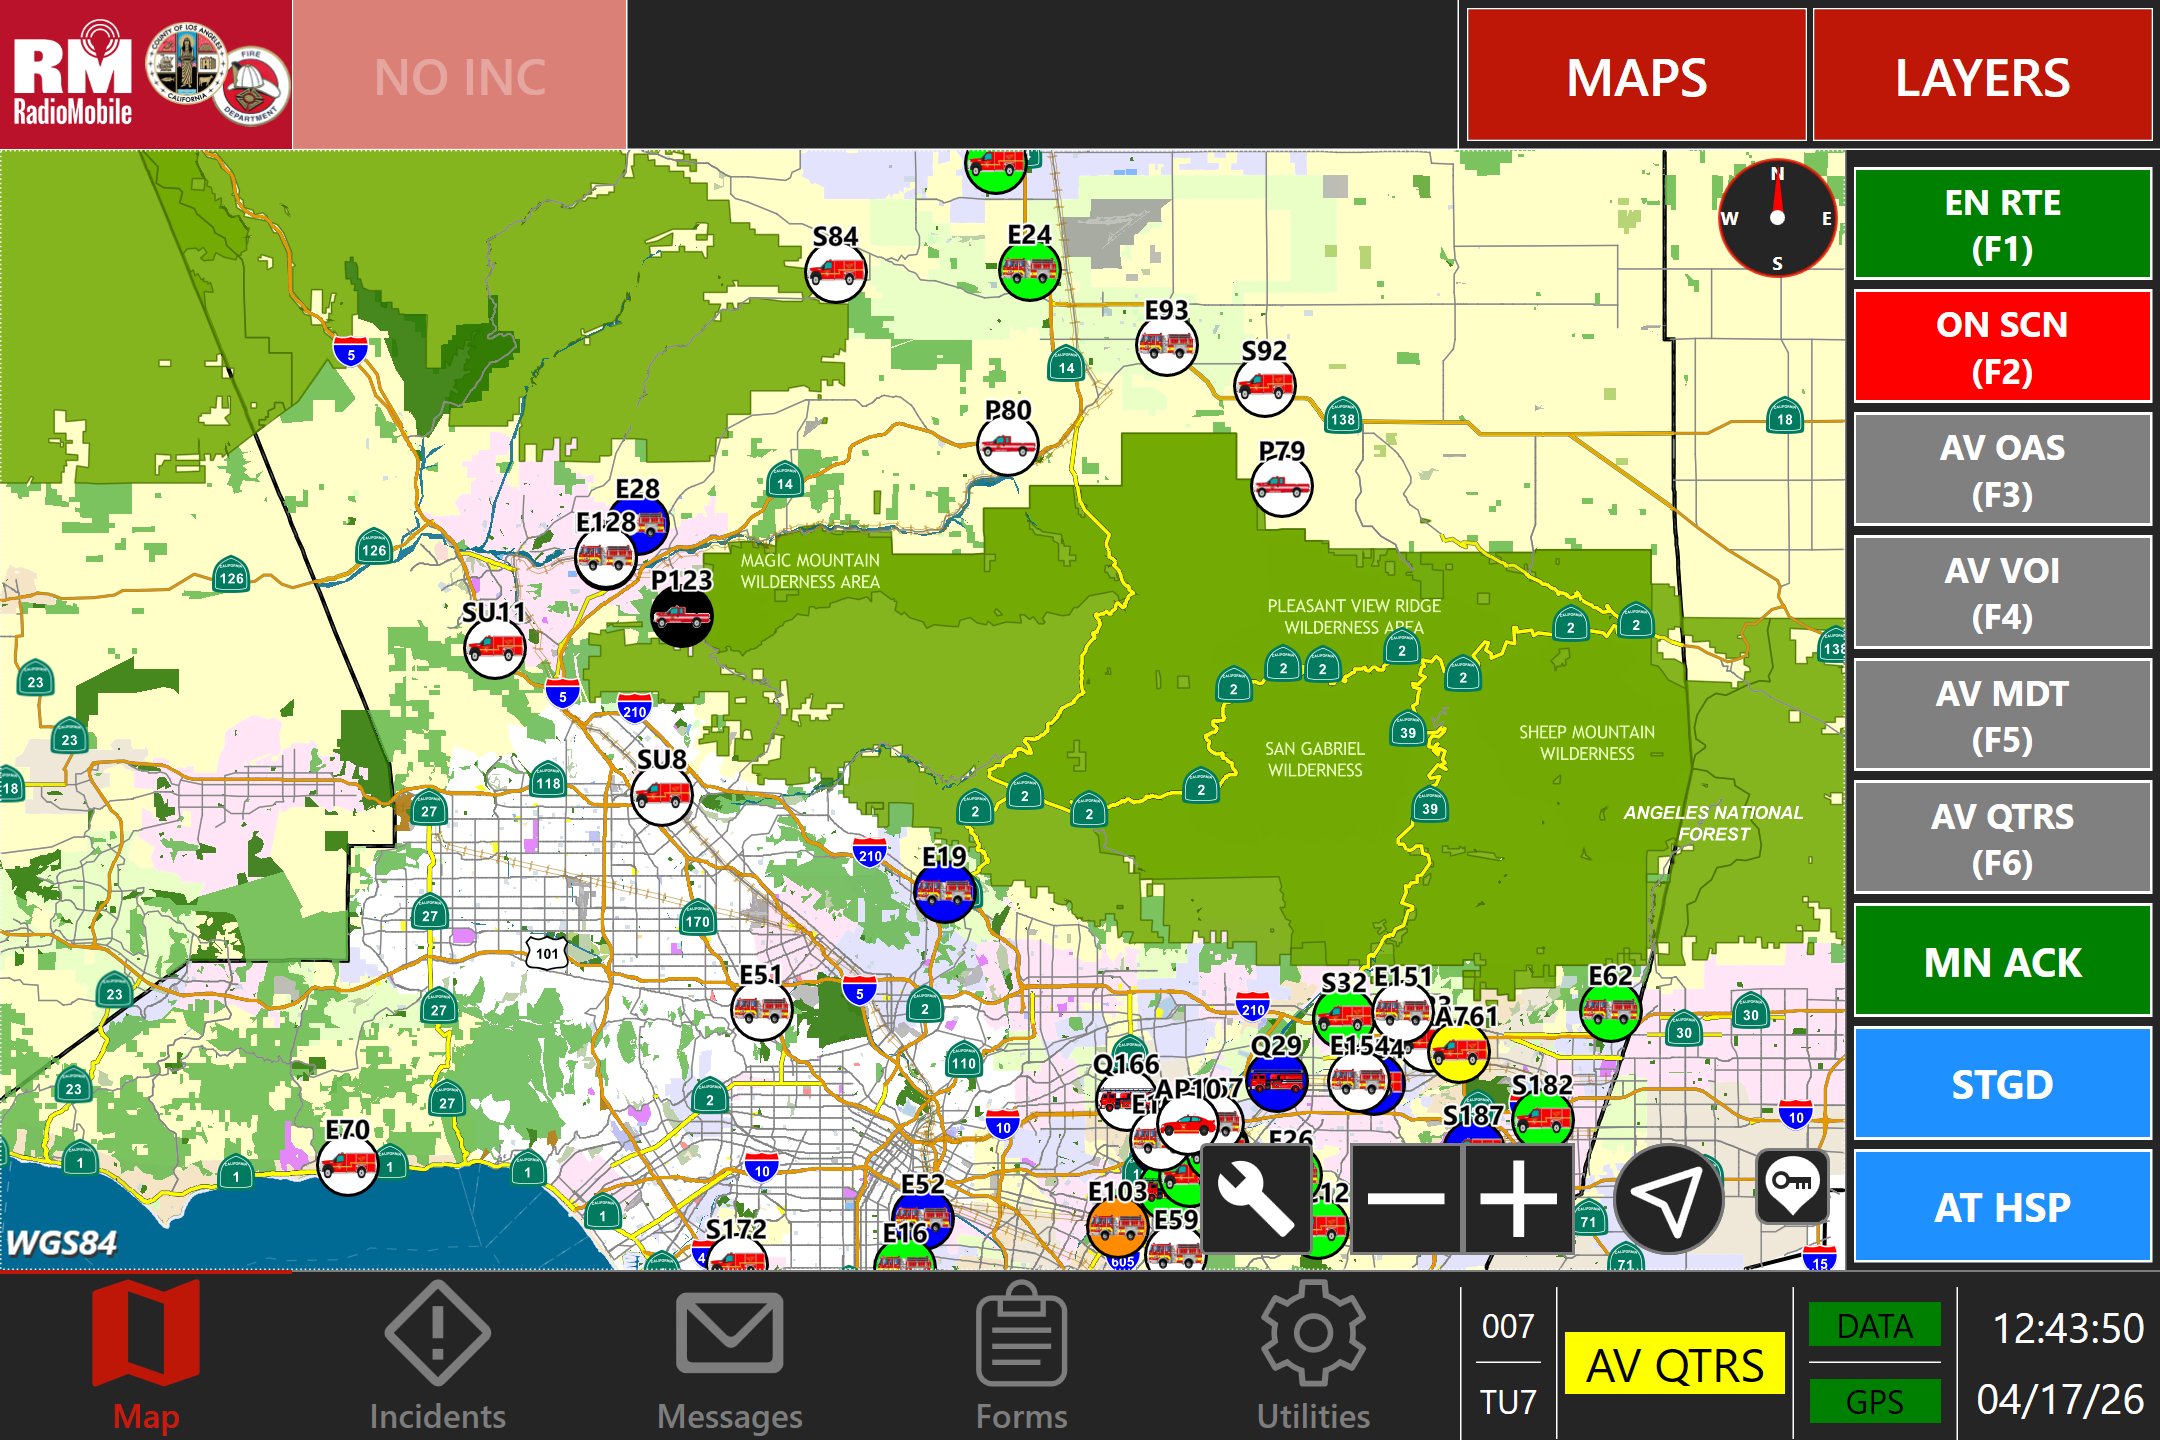
Quick answer: Integrating AVL with local GIS means combining live apparatus locations with spatial data your agency already maintains, including hydrants, pre-plans, fire service districts, fire perimeter, evacuation zones, road closures, structure threat, and hazard areas. By integrating AVL with GIS data, fire departments give responders, dispatchers, and incident commanders a true common operating picture instead of a vehicle map.
Successful AVL-GIS integration requires three foundations:
- Clean, current spatial data (typically in Esri ArcGIS)
- An AVL platform that supports open feature services and modern integration standards
- A delivery method that gets the combined picture onto the in-vehicle mobile computer terminal (either tablet or ruggedized MDT) and command displays in real time, even when the network degrades
Why AVL-GIS Integration Matters
Most fire departments already maintain at least some GIS data. The hydrant layer, the response district boundaries, the pre-plans, the wildland-urban interface (WUI) zones, the historical fire perimeter: these data sets exist, often maintained by a GIS analyst at the city or county level. The question is whether that data actually shows up where the crew, the dispatcher, and the IC can use it.
Integrating AVL with local GIS is what closes that gap. Done well, it transforms the apparatus mobile computer terminal from a navigation tool into a complete operational picture. Done poorly, it creates fragmented data, slow performance on the fireground, and friction that the crew works around rather than with.
This article walks through what AVL-GIS integration actually involves, the technical foundations that make it work, the most common pitfalls, and what fire departments should evaluate when they plan an integration.
What does it mean to integrate AVL with local GIS?
At a basic level, AVL-GIS integration means that the same map that shows live apparatus positions also shows the spatial data the agency maintains. That sounds simple. In practice, it has three distinct components:
- Data integration: Connecting the agency’s GIS data sources, typically Esri ArcGIS feature services, to the AVL platform’s mapping engine so layers render alongside live vehicle positions.
- Application integration: Surfacing the combined picture inside the tools responders and command staff actually use, including the in-vehicle mobile computer terminal, CAD workstations, and command displays.
- Operational integration: Making sure the data updates flow at the speed the operation requires: live for dynamic layers like fire perimeter, cached and synced for relatively static layers like hydrants, and that the system continues to function when network connectivity degrades.
A real integration spans all three. Many “GIS-integrated” AVL platforms only do the first one, data integration, and call it complete, which leaves the data stranded somewhere the responding crew can’t actually use it.
Which GIS layers matter most for fire response?
Fire departments typically maintain or have access to a range of GIS data. These GIS layers are spatial datasets a fire agency maintains to support response, planning and situational awareness. The layers that most directly support fireground operations include:
Hydrants and water sources
Fire hydrants, draft sites, dry hydrants, cisterns, and tactical water supply locations. Hydrant data is often maintained jointly with the water utility, with the fire department layering inspection status, flow data, and out-of-service flags. ArcGIS Solutions like Fire Hydrant Inspections and tools like ArcGIS Field Maps are common tools for keeping this data current.
Pre-plans
Pre-incident plans for commercial structures, high-life-safety occupancies (schools, hospitals, assisted living), industrial sites, and target hazards. Pre-plans typically include building footprint, occupancy type, construction features, hazard locations, utility shutoffs, FDC location, sprinkler and standpipe systems, and contact information. National frameworks from organizations like NAPSG Foundation and ArcGIS Solutions for pre-plan data collection help standardize this layer across agencies.
Fire service districts and response boundaries
Agency, battalion, district, station first-due, mutual aid zones, automatic aid agreements, and WUI boundaries. These polygons drive dispatch logic and reporting, and they layer onto AVL to show which units are operating inside or outside their primary response area.
Fire perimeter and active incident data
During active wildland and WUI incidents, the perimeter changes by the hour. Sources include CAL FIRE, NIFC, state forestry agencies, and operational data from the incident itself. This is the most dynamic layer and the one that benefits most from live integration.
Evacuation zones, road closures, and access constraints
Evacuation areas pushed from emergency management, road closures from DOT and law enforcement, bridge weight restrictions, locked gates, and access road conditions in remote terrain. These layers are essential during major incidents and often overlooked in routine response.
Structure threat and risk data
During wildland incidents, structures within the predicted fire path are categorized and prioritized for protection. CAL FIRE Damage Inspection (DINS) data, parcel data, building footprint, and defensible space attributes all feed this layer.
Hazards and known risk locations
Hazardous material storage, propane tanks, solar arrays, lithium battery storage facilities, electrical hazards, and other site-specific risks. This is increasingly important data as the built environment changes.
Routing and basemap data
Apparatus-appropriate routing (which avoids low bridges, weight-restricted roads, and gated communities), aerial imagery, contours, hillshades, and basemaps that perform well at the speeds fire apparatus actually move.
The technical foundations of a real AVL-GIS integration
Data sources and standards
Most U.S. fire department GIS data lives in the Esri ArcGIS ecosystem, exposed as feature services from ArcGIS Online or ArcGIS Enterprise. Modern AVL platforms should support:
- Esri feature services and map services: Direct consumption of REST endpoints from ArcGIS Online or Enterprise.
- OGC standards: WMS, WFS, and WMTS for non-Esri sources and broader interoperability.
- GeoJSON and KML: For ad hoc or partner-provided data, especially during multi-agency operations.
- MBTiles and offline tile packages: For basemap performance and offline operation in remote terrain.
- Live data feeds: Direct integration with CAL FIRE, NIFC, NWS, and other authoritative sources for fire perimeter, weather, and red flag warnings.
Update frequency by layer type
Not every layer needs to update at the same cadence. A well-architected integration tunes update frequency to layer behavior:
- Real-time (sub-minute): AVL positions, unit status, active incident data, drone telemetry.
- Near real-time (minutes to hourly): Fire perimeter during active wildland incidents, evacuation zones, road closures.
- Daily or weekly: Pre-plans (when updated), hazard data, structure threat assessments.
- Quarterly or as-needed: Hydrants (with inspection updates), district boundaries, basemaps.
Delivery to the in-vehicle mobile computer terminal
The integration is only as good as what the responder actually sees. A command-grade AVL-GIS architecture delivers the combined picture to the tablet or MDT inside the apparatus through incident management software like Tablet Command for iOS or IQ Mobile for Windows. The crew sees their position, the incident, the relevant GIS layers, and the positions of other units, all on one map, in real time, without having to flip between apps.
Offline and degraded-network operation
Connectivity will degrade. Tunnels, canyons, remote wildland terrain, and damaged infrastructure all break network assumptions. The integration must continue to function. That means cached basemaps and feature services, local data on the apparatus and command vehicle, and automatic resync when the link returns. Platforms that go blank when the network drops are not field-ready.
Performance and rendering
Fireground mobile devices are not always running on the latest hardware, and they are competing with other apps for memory and battery. GIS data has to render quickly. That means vector tiles where possible, layer-level visibility controls, and intelligent caching of frequently used layers. A pre-plan that takes fifteen seconds to load is a pre-plan the crew works around.
The most common pitfalls in AVL-GIS integration
Stale or inaccurate data
Integration does not fix bad data. A pre-plan that was last updated in 2018 is a pre-plan that may misrepresent the building today. Hydrants that are out of service but still showing as active in GIS cause real problems on the fireground. A successful integration requires a maintenance program for the underlying data, not just a technical hookup.
Layer overload
Adding every possible layer to the fireground mobile device does not improve situational awareness. It overwhelms the user. The strongest integrations curate the default layer set for response use, with the ability to toggle additional layers when needed. The IC’s view is not the same as the engine crew’s view.
Network dependency without offline fallback
Integrations that assume continuous connectivity fail in the environments where fire departments most need them. Offline-capable integration is not optional. It is foundational.
GIS as an isolated function
If GIS lives only with a city or county analyst and is not coordinated with fire operations, the integration drifts. The strongest GIS programs have a fire-service champion who understands both sides: the spatial data and the operational use, and bridges between them.
Vendor lock-in to proprietary data formats
AVL platforms that only support their own proprietary data format trap the agency. Open standards (Esri feature services, OGC standards, GeoJSON) protect the agency’s ability to switch vendors, add data sources, and integrate with mutual-aid partners.
Frequently asked questions
Do fire departments need their own GIS staff to integrate AVL with GIS?
Not necessarily, but they need access to GIS expertise. Many departments share GIS staff with the city or county. Others rely on a GIS analyst at the regional or state level. The key is having someone who can maintain the data, curate the layers, and coordinate with the AVL vendor on integration. A fire department without any GIS support will struggle to get value from the integration.
What if the city or county GIS data isn’t current?
This is common. The integration project is often the forcing function that drives a data refresh. Start with the layers that matter most for response: hydrants, pre-plans for target hazards, response districts, and stand up an ongoing maintenance process. ArcGIS Field Maps and similar tools make it possible for line personnel to update data during routine activities like hydrant inspections.
How does AVL-GIS integration work during wildland and WUI incidents?
Active wildland incidents bring in additional authoritative data sources, including CAL FIRE perimeter data, NIFC IRWIN, weather feeds, and structure threat assessments. The strongest AVL platforms ingest these feeds in real time during the incident and surface them on the apparatus and command displays alongside the agency’s standing GIS layers.
Can multiple agencies see each other’s GIS data on the same operational picture?
Yes, when the platform supports multi-agency GIS sharing and the agencies have established the data-sharing relationships. This is essential for mutual aid and unified command operations. Open data formats make this much easier than proprietary ones.
Does AVL-GIS integration improve ISO ratings?
Indirectly. ISO Public Protection Classification evaluates communications, dispatch, and water supply, all of which are supported by strong GIS integration. Documented hydrant data, accurate response districts, and verifiable dispatch performance all contribute to ISO scoring. AVL-GIS integration alone does not change the rating, but it supports the underlying performance that does.
How long does an AVL-GIS integration take to implement?
It depends on the state of the agency’s GIS data and the complexity of the layer set. A department with current, well-organized GIS data and an AVL platform that supports open standards can stand up basic integration in weeks. Departments starting from less-organized data should expect a multi-month project that includes data cleanup, layer design, and operational testing.
What fire departments should evaluate when selecting an AVL platform for GIS integration
- Open standards support: Esri feature services, OGC standards, GeoJSON, KML, not proprietary-only formats.
- Layer management and curation: Ability to design role-specific layer sets for engine crews, command, and dispatch.
- Real-time data ingestion: Direct integration with CAL FIRE, NIFC, NWS, and other authoritative feeds for active incidents.
- Offline capability: Cached basemaps and feature data, automatic resync, graceful degradation under poor connectivity.
- MCT integration: Combined AVL and GIS view delivered to the in-vehicle tablets or MDTs through incident management software the crew already uses.
- Performance and rendering: Fast layer load times, intelligent caching, vector tile support.
- Multi-agency support: Ability to share and consume partner agency data during mutual aid.
- Connectivity architecture: Multi-bearer SD-WAN that keeps live GIS data flowing during incidents in remote terrain.
The bottom line
AVL-GIS integration is what turns a vehicle map into a fire department operational picture. The technology to do it well exists. The data, in most agencies, already exists. The gap is usually in how the two are connected, who maintains them, and whether the combined picture actually makes it to the responder in the field.
For departments planning an integration in 2026, the path forward starts with three questions:
- What GIS data do we already have, and what condition is it in?
- What AVL platform can consume that data through open standards and deliver the combined picture to the apparatus mobile data terminal?
- And who in our organization owns the ongoing relationship between operations and GIS?
Answer those three, and the integration follows.
Why fire agencies choose RadioMobile for AVL-GIS integration
RadioMobile provides AVL-GIS integration built for fire-service operations. The platform supports Esri ArcGIS feature services and live data feeds from CAL FIRE, NIFC, and other authoritative sources. The combined operational picture is delivered to the apparatus mobile computer terminal incident command software such as Tablet Command for iOS and IQ Mobile for Windows.
Multi-bearer SD-WAN connectivity bonding FirstNet, Verizon, and T-Mobile cellular with Starlink and OneWeb LEO satellite keeps live GIS layers flowing even in remote wildland terrain, with offline caching and automatic resync when connectivity degrades.
RadioMobile partners with agency GIS teams from initial integration design through ongoing operational tuning, ensuring that the data, the application, and the operational use all work together the way fire service operations actually demand. The platform is deployed across CAL FIRE and many of the largest fire agencies in California.
Learn more or schedule a discovery call at radiomobile.com.